Violence reduction and less crime.
No doubt the forthcoming elections are what’s prompting the Metropolitan Police to send this message of success. After all, the Mayor of London, Sadiq Khan, is the boss of the service.
New figures released today (Monday, 12 January) confirm there were
- 2025
- 97 homicide
- 2024
- 109 homicides
97 homicides in 2025, an 11% reduction on 2024 (109) – this represents the lowest total since 2014, with London’s population having risen by more than half a million since then.
In the same period, violent incidents resulting in injury fell by a fifth, while firearms discharges are less than half what they were seven years ago. This milestone comes despite London’s population growing significantly over the past decade, making the capital safer than ever.
The Met’s work to tackle homicide has also delivered exceptional justice outcomes. In 2025, 95% of homicide investigations resulted in a positive outcome, and London’s homicide rate now stands at 1.1 per 100,000 people. This makes the homicide rate lower than any other UK city and below many comparable global cities, including New York (2.8%), Berlin (3.2), Milan (1.6) and Toronto (1.6). It is also significantly lower than rates seen in major US cities such as Los Angeles (5.6), Houston (10.5), Chicago (11.7) and Philadelphia (12.3).
We also hear of County lines disruptions and youth work.
Obviously in not so many words, those who want crime reduction must stop using any products or services sold through criminal networks.
Those knowing of any criminal activity must report it.
Tower Hamlets Crime Watch remind you to report directly to Metropolitan Police and not to THEOs.
Continuous work with young people is important. We must keep an eye on local figures to ensure Tower Hamlets doesn’t fall below the standards achieved.
Regularly our neighbouring borough to the East, Newham reports highest crime, whilst our nearest neighbour to the West, the City of London, is not part of Met Police operations. But Westminster, as tourist and entertainment hub attracts many problems.
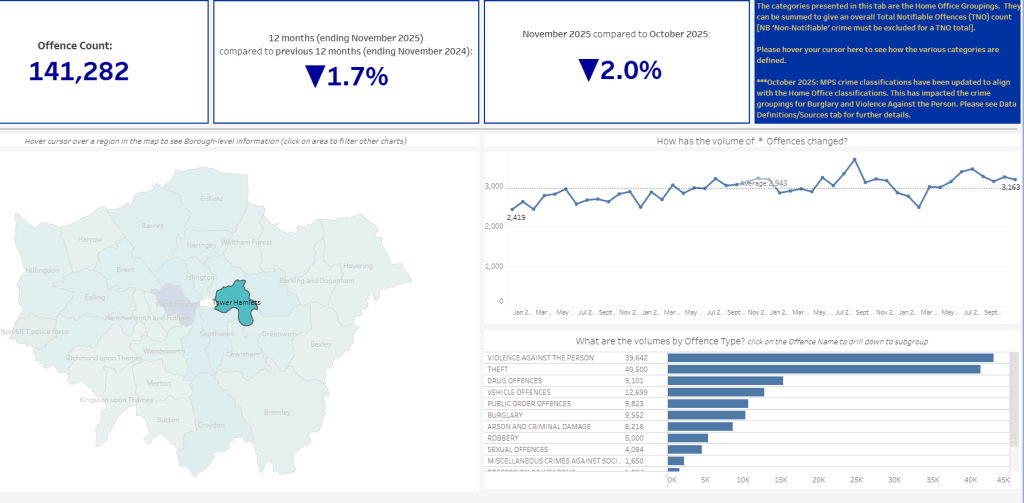
Overview of crime
Tower Hamlets
Please keep reporting to Police directly; to achieve even better results for Tower Hamlets do NOT report crimes to THEOs who have very limited powers. See table of details.
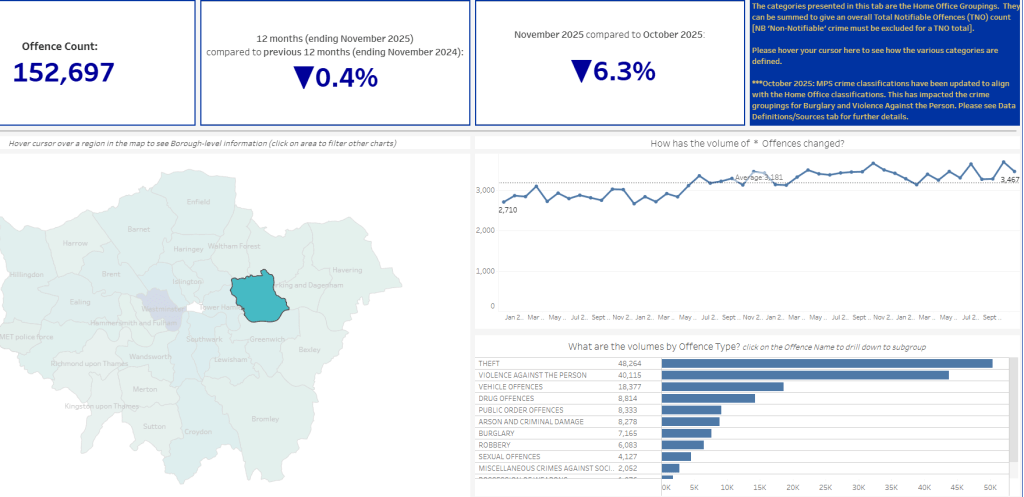
Newham
Westminster

City of London
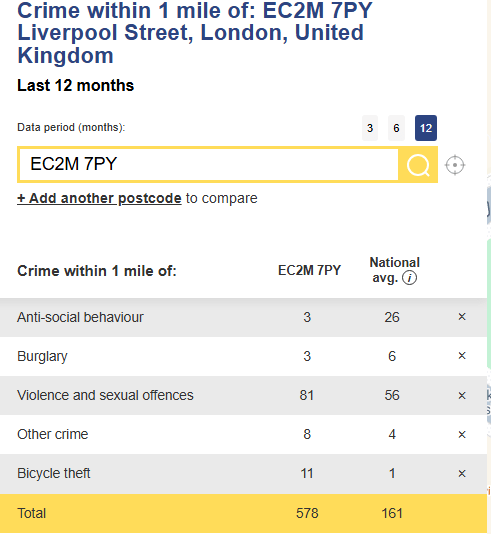
City of London does not produce the same type statistics as the Met Police.
Interactive Crime map
Check your area crime rates with this interactive crime map https://www.adt.co.uk/crime-in-my-area

Keep reporting to reduce crime in Tower Hamlets further.
Please do not make the mistake to report crime to Tower Hamlets THEO officers. They have no sufficient powers and you cannot rely on them passing on your reports to police.
We have compiled a table to show you the comparison of powers between Met Police PCSO and Tower Hamlets THEO officers. Of course PC officers from Met Police and higher have even more powers.
| Aspect | PCSOs | THEOs |
| Employer | Metropolitan Police | Tower Hamlets Council |
| Wages | PCSO start ~33,000 PC start £42,210 | THEO start # £36,000 THEO annual £42,720 |
| Core Focus | Neighbourhood Policing, ASB, minor offences, intelligence gathering | ASB, environmental crimes, drug outreach, community support |
| Standard Powers | 20+ (e.g. 30 min. detention, vehicle stops, litter fines, alcohol seizure. | Limited CSAS (e.g., name/address requirement, fines for ASB or environmental issues) |
| Arrest/Detention | limited detention up to 30 mins, request police arrest | None |
| Search powers | None (cannot stop a. search) | None |
| Enforcement tools | Fixed penalties, notices, some equipment (e.g., handcuffs in select forces) | Fixed penalties, seizures, injunction support; no equipment like sprays |
| Training | 4-11 weeks, incl. use of force, evidence handling, radio procedure | Community safety, first aid, outreach; no mandatory policing training |
| Scope | broader policing integration; can support crime scenes, traffic surveys | Council-led, patrols with police but focused on local bylaws and referrals |
| Limitations | No full arrest, interviews, or high-risk tasks | Narrower, non-police remit; cannot handle civil disorder independently |
