
Interactive Crime map
Check your area crime rates with this interactive crime map https://www.adt.co.uk/crime-in-my-area
Tower Hamlets 2025 Crime Scorecard
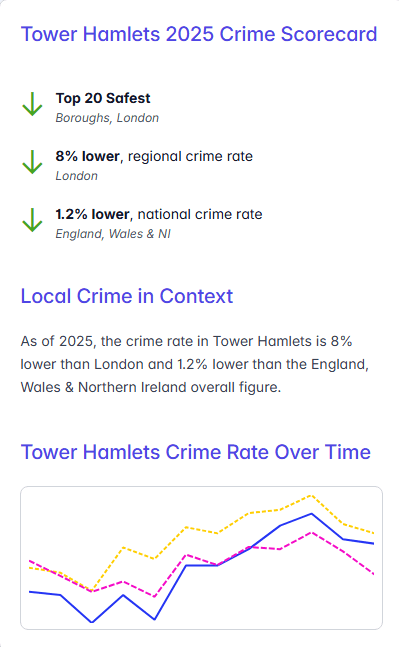

the interactive map results show Tower Hamlets as fifth highest crimes in London whilst the crime score card shows Tower Hamlets as within the 20 safest boroughs. It’s puzzling.
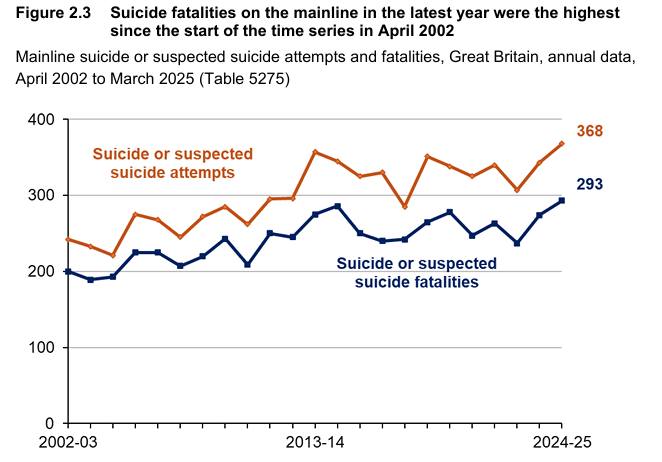
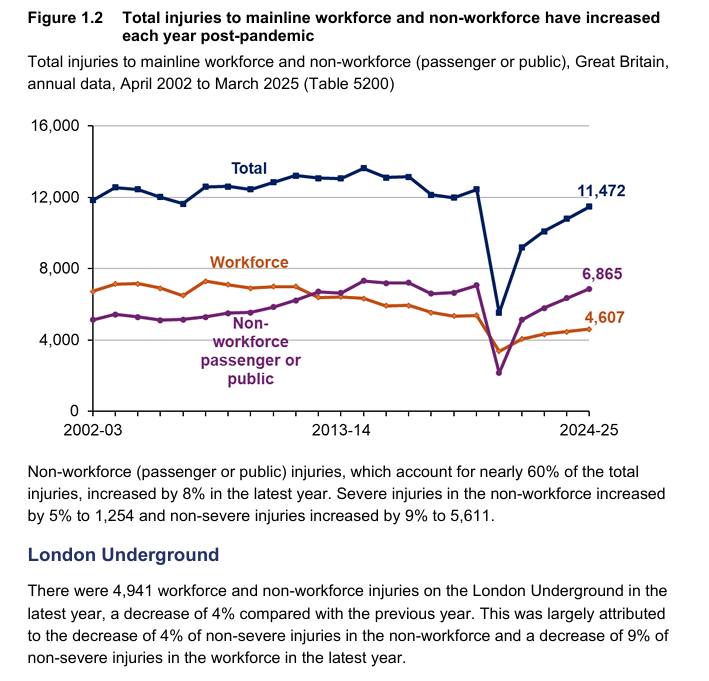
Passenger and public assaults have sharply risen on the rail and train network. See this document for comprehensive statistics from the Office of Rail and Road

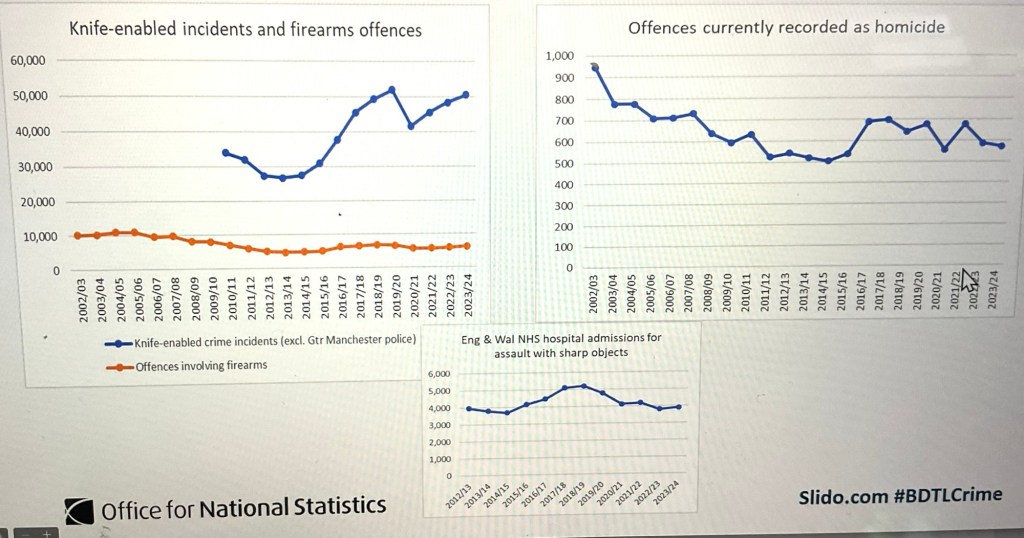
We are looking at the Mayor of London claim that homicides in London are the lowest since ‘monthly’ records began.
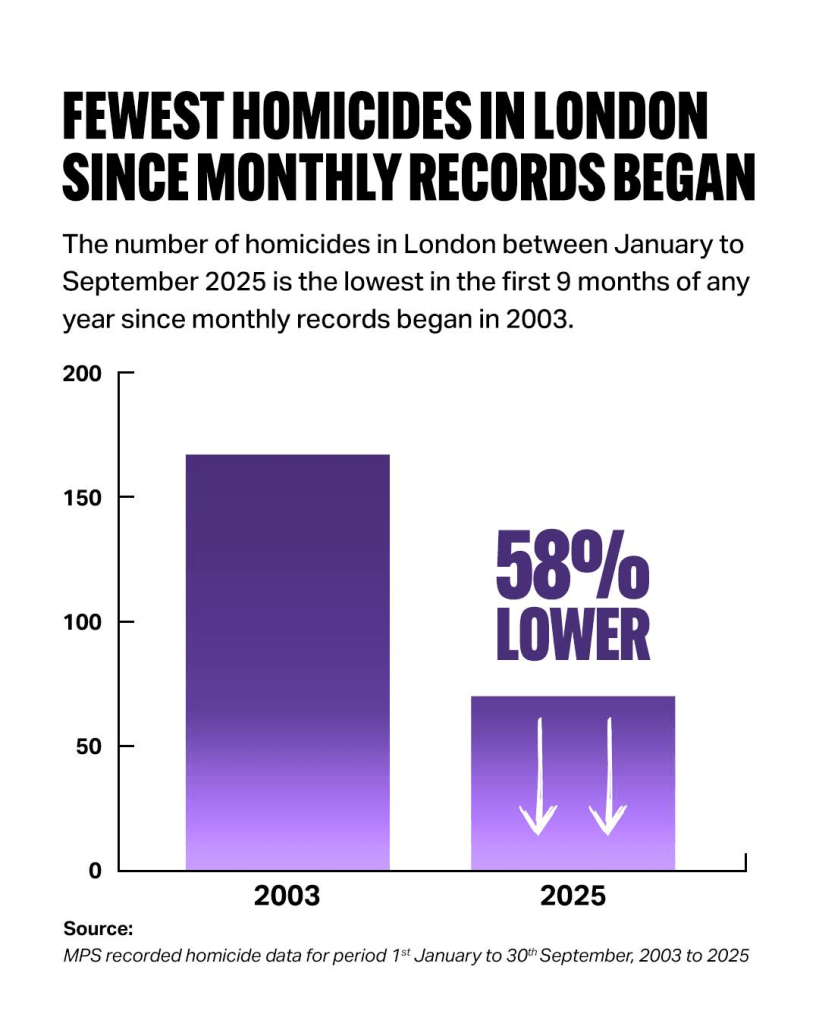
This graphic was distributed by the Mayor of London MOPAC in autumn 2025 and it claims that homicides in London are the lowest since ‘monthly’ records began. This does now show a consequential time line of statgs.

We have compiled a statistical time-line showing the yearly homicides in London and the picture looks very different.
The lowest homicides were recorded 2011 – 2014. Total 2,912. Source
2025 estimates
As of October 2025, approximately 90 homicides have been recorded (based on mid-term trends from MPS and ONS year-to-date figures.
Treatments lower the homicide rate
Advances in trauma care, faster emergency response, better surgical techniques reduced lethality from 20-25% in the 1990’s to 5-10% today for hospitalised cases.
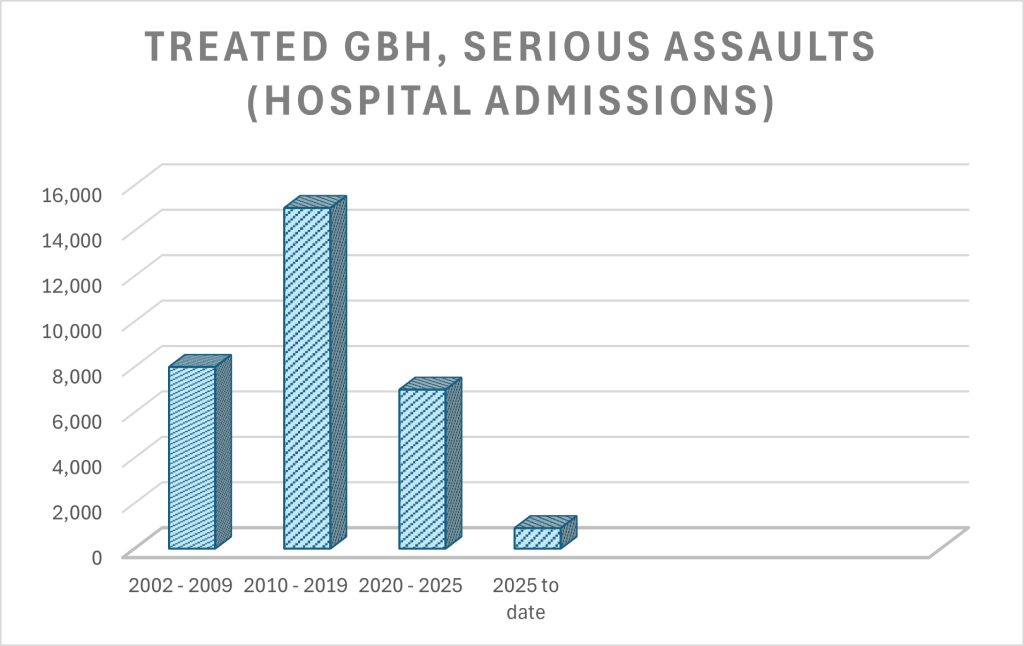
Despite a ~80% rise in recorded knife offences since 2013 from 25,000 – 45,000 nationally, homicides fell due to higher survival rate. London survival rate 90-95%. source
Overview of crime Tower Hamlets
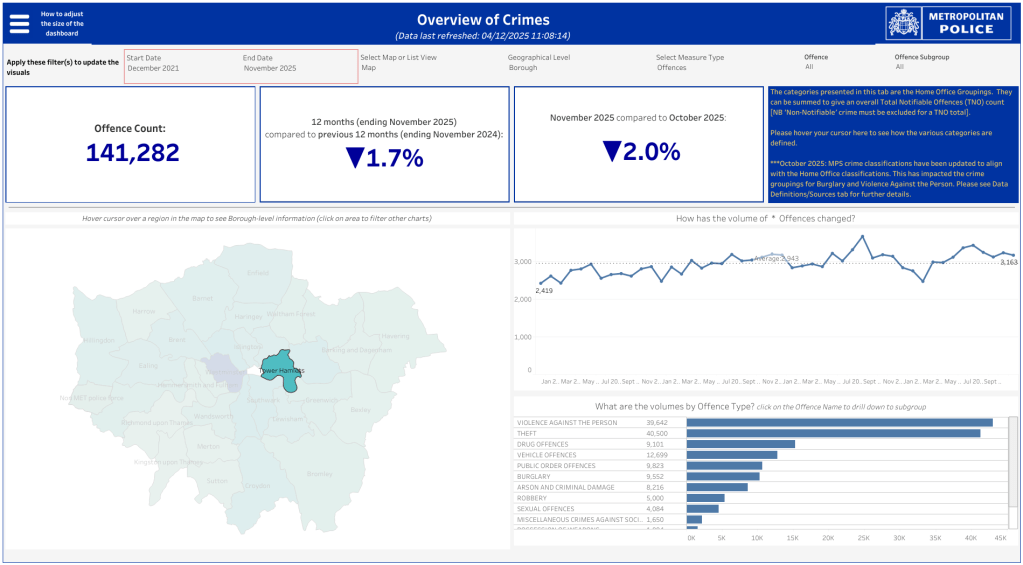

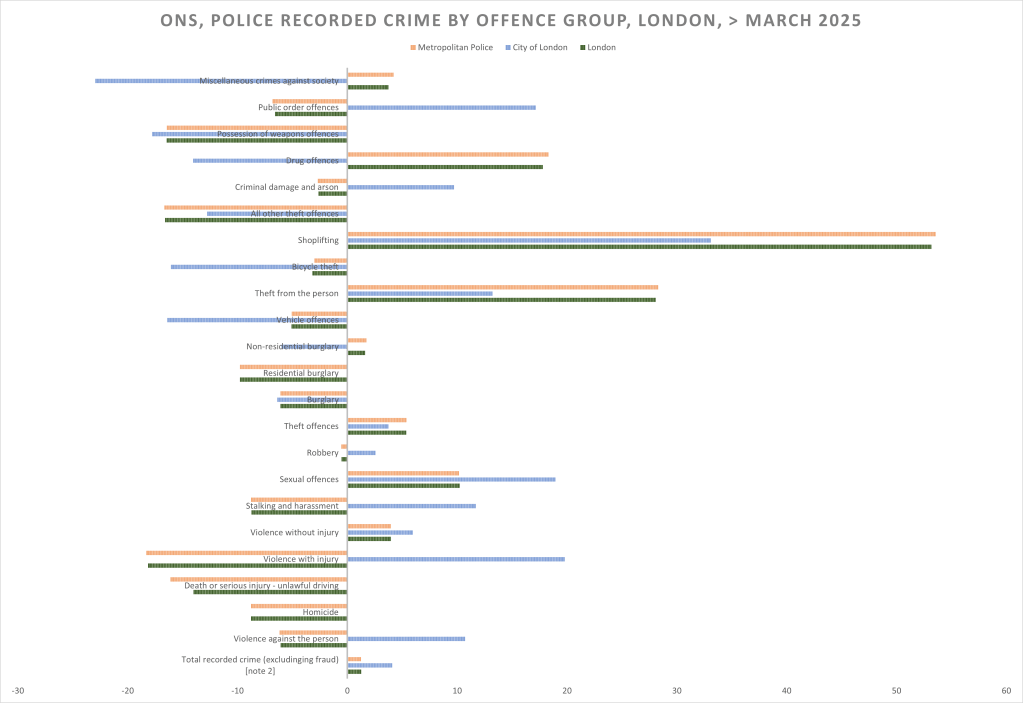
ONS statistics
See latest all London statistics in Chart format.


London Policing Board
LPB Data Dashboard
The Members of the London Policing Board use a variety of data as part of their oversight of the reform of the Metropolitan Police Service.
We have produced and published an interactive dashboard to allow users to see and explore this data – access it here.
Ombudsman statistics for Tower Hamlets.
We make the pdf and other formats available to members on request.
Fraud
Please visit our Fraud and Cybercrime page for the full version
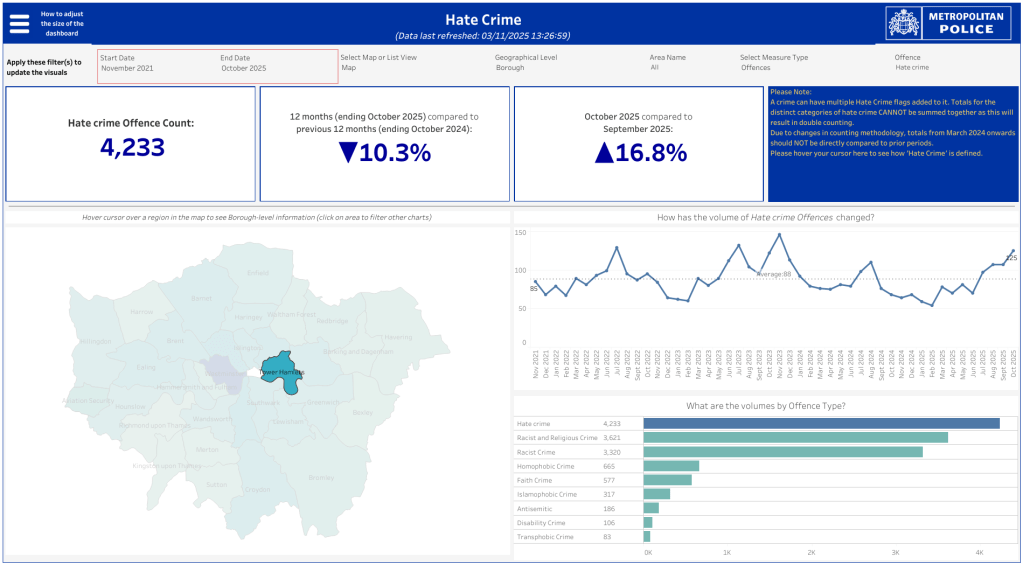
Hate crime
visit our hate crime pages, also offering links to Tower Hamlets

Business Crime

the format of displaying business crime has changed. We have combined two pictures to enable an overview.
See Met Police produced crime stats for the borough, choose the relevant borough from the map.
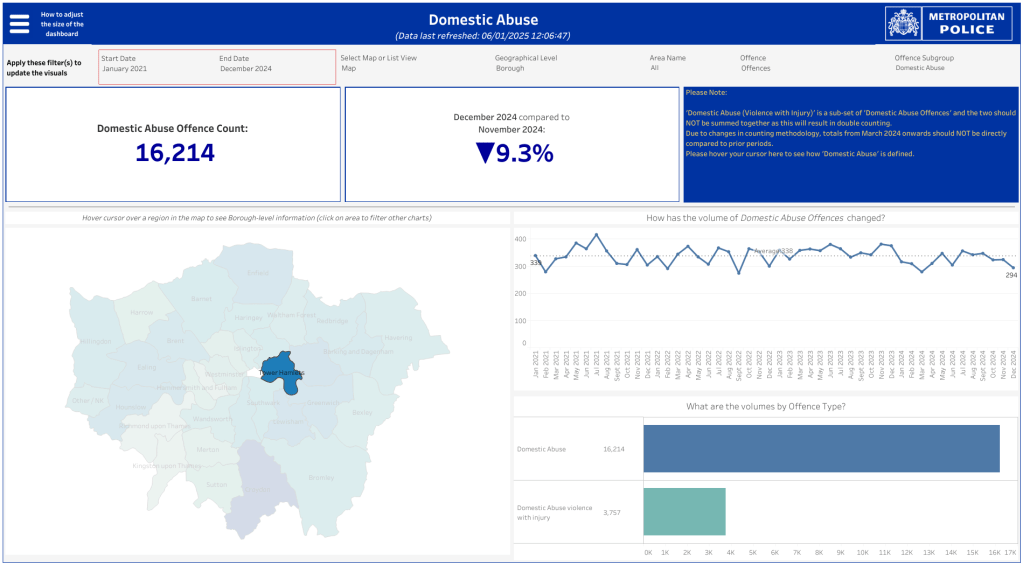
Domestic Abuse


Knife crime and offensive weapons

Gun crime
- Total Estimate:
- Possession of weapons offences (predominantly firearms and knives in this borough): 373 for the year. 73 This yields a rate of 0.696 per 1,000 population.
Context and Trends:
Tower Hamlets saw strong reductions in violent crime leading to injury (one of the largest drops among London boroughs, ~12% overall), including gun-related incidents. 15 Firearm discharges in London fell 43% in the year to June 2025. 53
Earlier data (year ending March 2024): ~214 total possession of weapons offences, with firearms ~20% (~43), indicating an upward trend to ~75 by mid-2025 due to imitation firearm threats bucking national declines. 2 1
Borough population: ~320,000, making the rate ~0.23 per 1,000—low compared to London’s average (~0.30 per 1,000 for the Met’s 1,582 offences).
Criminal Court stats
See here the national statistics from the Ministry of Justice, Summary tables and Pocketbook. November 2024
Proven re-offending statistics
https://www.gov.uk/government/collections/criminal-justice-statistics
Office for National Statistics ONS Crime and Justice Statistics to December 2024
MOPAC published actual crime stats, select your options
Robbery
Data published by the Office for National Statistics shows that robbery in London has risen 57 per cent since Mr Khan took office in 2016.
While 21,604 offences were recorded in the capital in the period from April 2015 to March 2016, the figure stood at 33,951 over the 12 months of 2023.
The increase across the whole of England and Wales between the same two periods was slightly higher however, at 59 per cent.
Cyber Crime
See links to the crime prevention advice
see all pages of this letter on our Fraud page in pdf and jpeg
* Tower Hamlets is among the top 20 safest boroughs in London. The overall crime rate in Tower Hamlets in 2023 was 99 crimes per 1,000 people. This compares favourably to London’s overall crime rate, coming in 6% lower than the London rate of 105 per 1,000 daytime population. For England, Wales, and Northern Ireland as a whole, Tower Hamlets is among the top 20 safest cities, and the 1,097th most dangerous location out of all towns, cities, and villages.
In August 2022, Tower Hamlets had the worst crime rate in London for anti-social behaviour, with 1,435 crimes reported and a crime rate of 3.9 per 1,000 daytime population. January 2021 was also a bad month for Tower Hamlets residents, when it was London’s most dangerous area for drugs, recording 294 crimes at a rate of 0.80 per 1,000 daytime population.
The most common crimes in Tower Hamlets are violence and sexual offences, with 10,969 offences during 2023, giving a crime rate of 30. This is 8% higher than 2022’s figure of 10,180 offences and a difference of 2.14 from 2022’s crime rate of 28. Tower Hamlets’ least common crimes are possession of weapons, with 213 offences recorded in 2023, a decrease of 0.93% from 2022’s figure of 215 crimes. Source Crimerate.co.uk
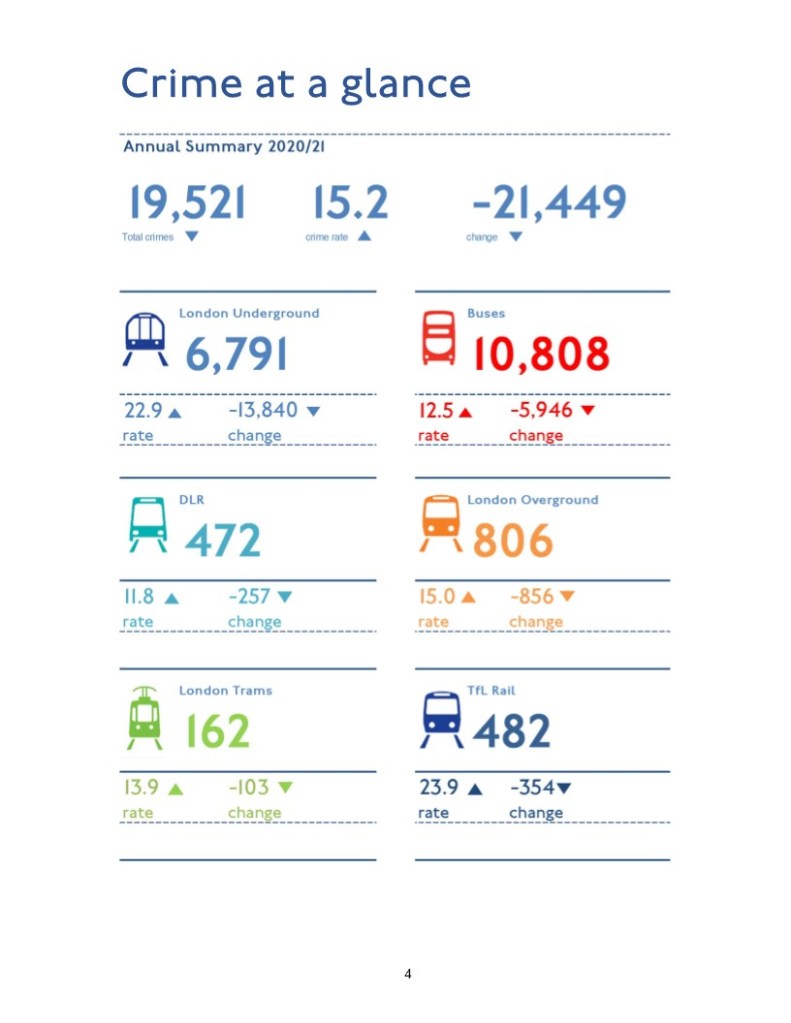
TfL
See the report up to 2021
see full report below.
Based on crime data, here are the most dangerous London Underground stations:
- Paddington: Topping the list with 232 reported crimes in January, the most common category near this station was violence and sexual offenses1.
- Liverpool Street: Coming in second with 232 reported crimes, most incidents were linked to anti-social behavior.
- Victoria: Ranked third, Victoria station recorded 157 crimes, primarily violent and sexual offenses.
- London Bridge: Fourth on the list, London Bridge had 136 recorded crimes.
- King’s Cross: Placing fifth, King’s Cross recorded 120 crimes1.
Terrorism

